FinTech · Dashboard
Investment Dashboard Design
A portfolio and market dashboard for retail investors: holdings, performance and watchlists on one screen.
About the project
What was designed.
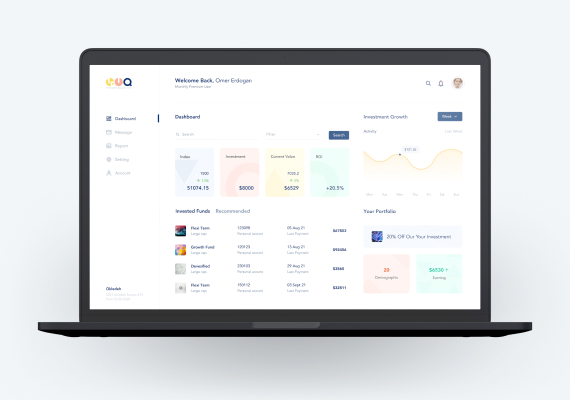
The dashboard opens on the four numbers an investor checks first: index level, amount invested, current value and return. Each sits in its own tinted card across the top, so the eye lands on the one it came for without reading labels. Everything below answers a follow-up question: how the portfolio moved this week, which funds are held, what was paid and when.
We kept the page to two columns on one light surface. Growth is a soft line chart with a period switch and a value on hover, not a wall of candlesticks; holdings are a scannable list (fund, class, units, last payment, value) rather than a dense table. The left rail stays deliberately short at five destinations with one active. The type scale, spacing and pastel card set were built as reusable components, so a new metric drops in without redrawing the page.
Get a free 15-point UX audit of your product.
Send us the link. Within one working day you get what to fix first, and why.